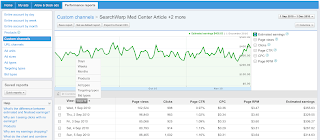
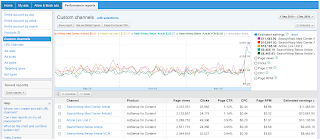
 These features are found in the Performance Reports tab, under Custom channels. Depending on the number of channels you’re using, you might be asked to filter the list and then click Update report button. Once your selected channels are listed below the graph, you can view the combine and chart buttons.
Let’s review the combine feature first, which can be used to easily total items in your list and allow for deeper analysis. Click a few of your channels that you want to view earnings for together, then click the Combine button. The total of these channels is now shown on the graph and you can do further analysis using the view drop-down.

In contrast, the chart feature lets you visually compare the performance of up to five items. First reset your channels report by clicking the word Custom channels above the graph. From here, select a few channels in the table and then hit the Chart button. The lines in the graph represent the statistics you have chosen. Just like with the combine feature, you can now refine your report further using the view drop-down above the table.

Try it now! Navigate to the new interface and click on the Performance Reports tab, and then click Custom Channels and Update report.
No comments:
Post a Comment